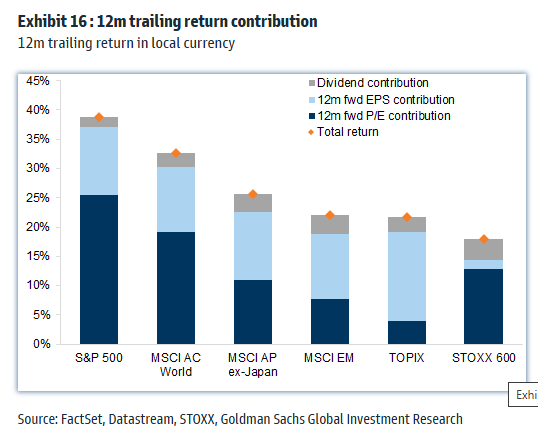
This week’s chart examines the contribution to returns for various equity markets over the last 12 months. Starting with the S&P 500, the total return for the last year is nearly 40%. Notably, more than half of this return is attributed to multiple expansion, meaning prices have risen faster than earnings. The valuation multiples for the S&P 500, which currently exceed 22 times earnings, have generated considerable discussion, as historical trends suggest that such high valuations may lead to lower future returns. To also note, and somewhat forgotten when the index has returned almost 40%, earnings per share (EPS) growth has been robust, exceeding 10%. The MSCI AC World Index, representing global stocks, has experienced a similar trend over the past year to the S&P 500. In contrast, other markets, such as the MSCI Emerging Markets (EM) index, have seen returns more driven by earnings growth.