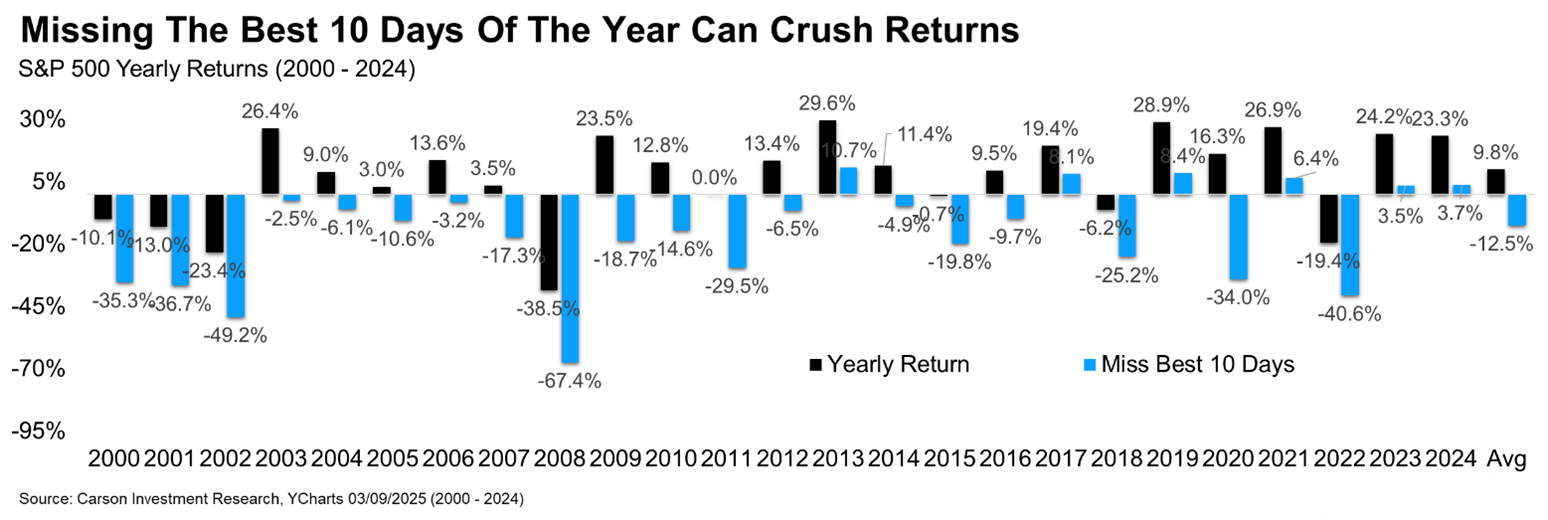
Our chart of the week compares annual S&P 500 returns with those excluding the 10 best market days. We often caution against market timing, as the best days tend to cluster around the worst days. Missing these key days can significantly harm annual returns; only a handful of years since 2000 yielded positive returns without them. Notably, the average return over this period was -12.5% for those who missed these days, compared to the long-term average of 10% for investors who stayed the course through market volatility. While large down days can be unsettling, it’s important to remember that markets are forward-looking, and positive surprises often follow periods of low expectations.