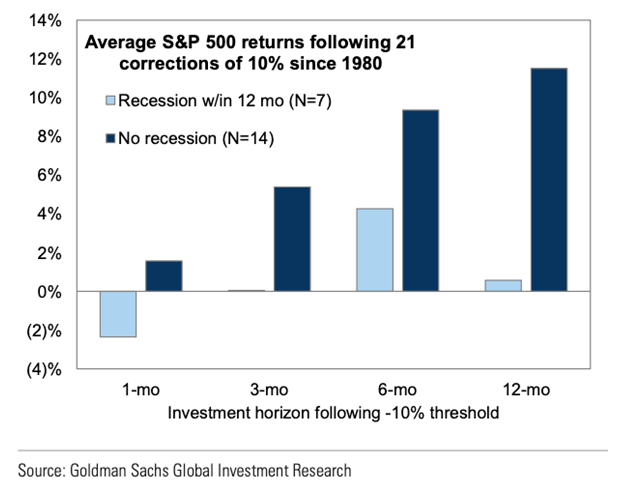
The chart of the week examines historical instances when the S&P 500 experienced a decline of 10% or more — a scenario that has occurred 21 times over the past 45 years. The chart highlights how future returns differ based on whether the economy entered a recession during these periods. On average, data shows that returns tend to be worse during recessionary times, which is understandable. While being invested during a market correction is rarely enjoyable, the returns that follow these declines have generally been positive. Historically, the market has shown gains 12 months after such corrections. A crucial factor moving forward is the recession outlook, as returns are significantly better when no recession occurs. Additionally, while a 10% drop in stocks can be painful for investors, many portfolios are diversified across various asset classes — such as bonds and cash — which often perform better during turbulent periods.