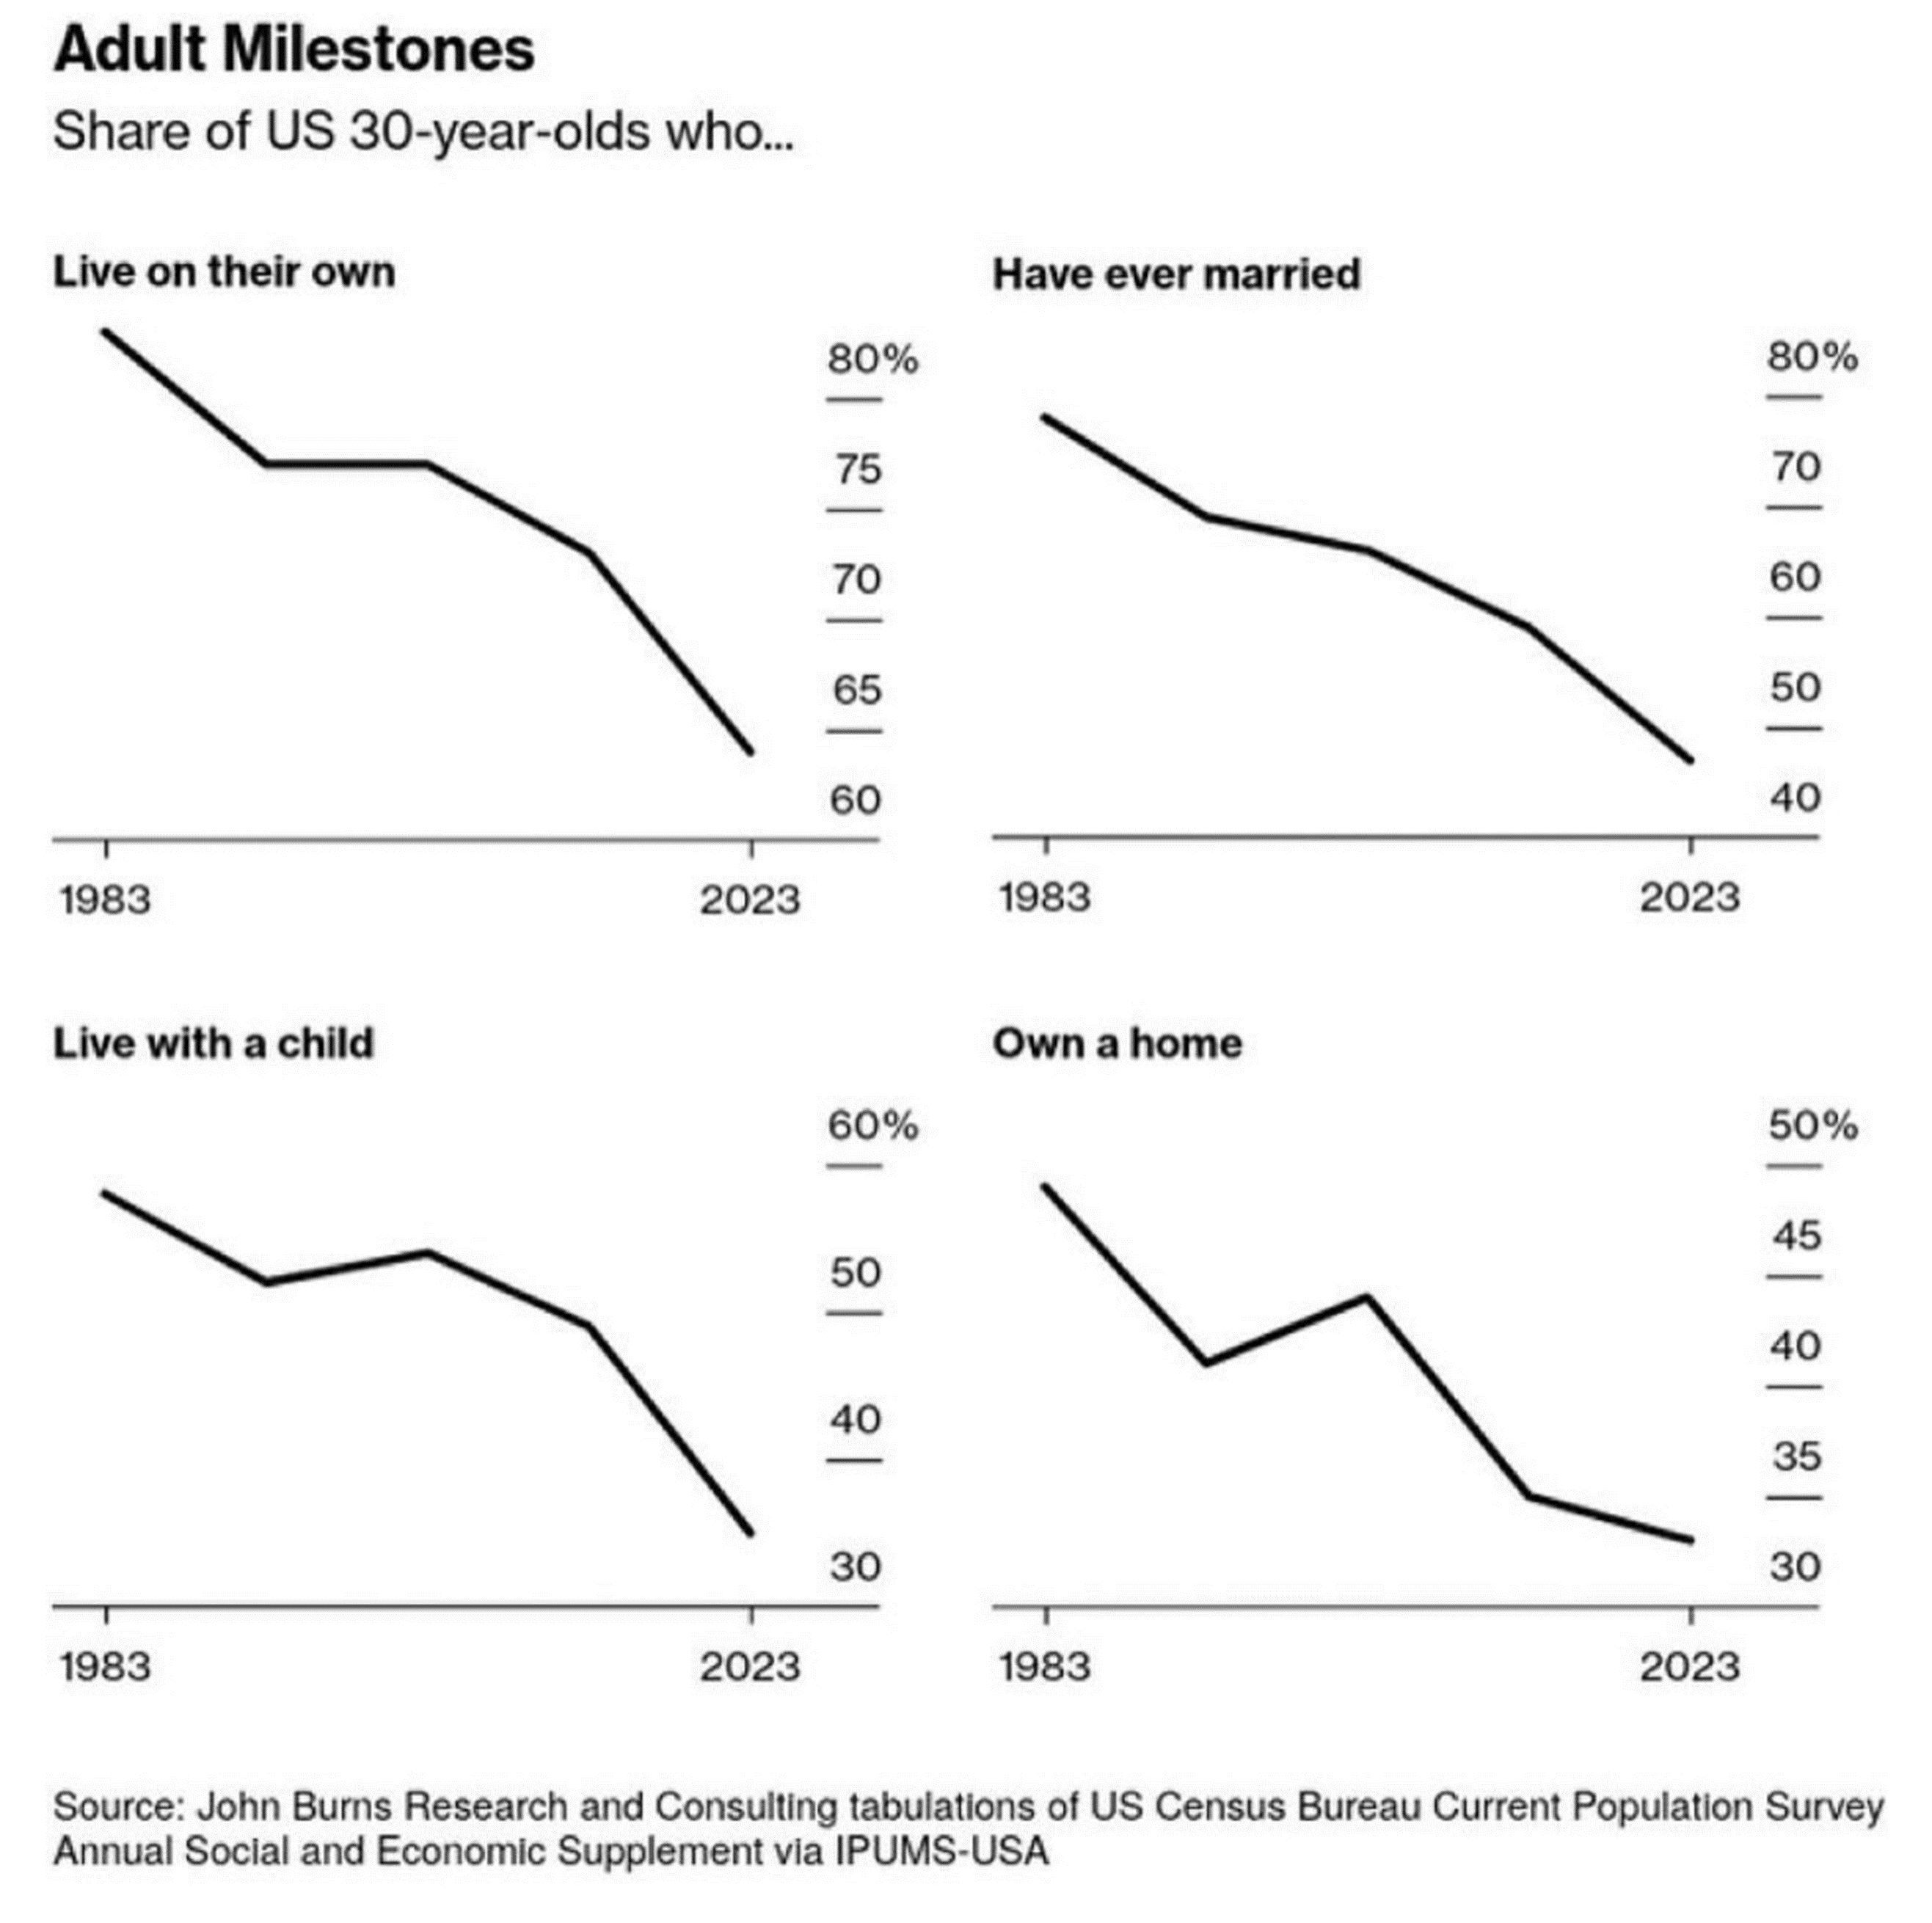
The chart of the week examines the changes that 30-year-olds in the United States have experienced over the last 40 years. There is talk about how much things have changed “since I was your age” and this chart proves that things have indeed changed! The four areas shown are 30-year-olds living on their own, having ever been married, owning a home and living with a child. All of these have shown substantial decreases over the 40 years, with living independently and owning a home decreasing by about 15%, which is quite significant. Even more striking is the decline in the percentage of individuals who have ever been married and those living with a child, both of which have essentially been cut in half. These are genuine trends that have an impact on everyday lives and also have significant implications for the economy and investment markets.