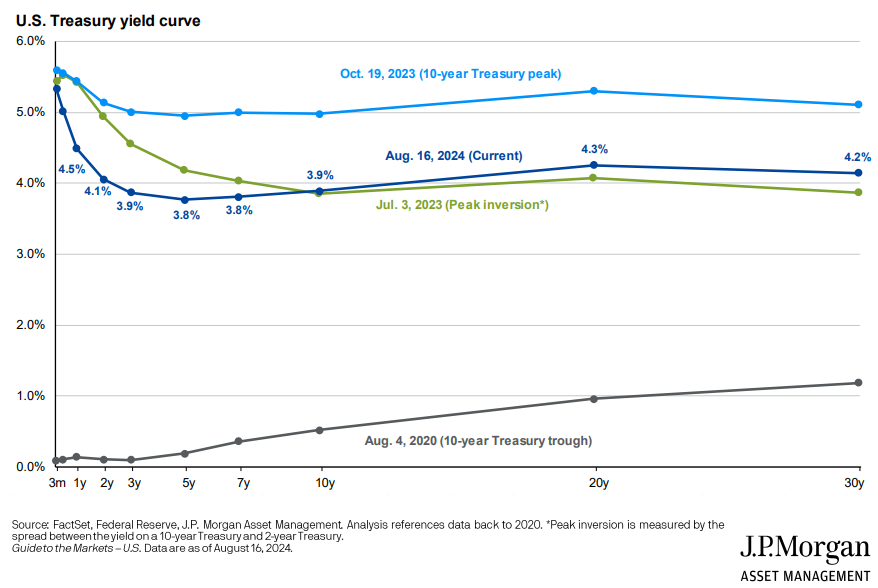
The chart of the week displays the US Treasury yield curve at four different dates. In August 2020, the yield curve reached its lowest point, with the 10-year Treasury falling below 1% for the first time in history. During the most recent cycle, the yield curve peaked in October 2023, before the Fed signaled rate cuts in 2024. Currently, short-term rates remain high, while rates longer than 3 months are anticipating the upcoming Fed rate cuts. The Fed’s rate cuts initiation process, an election in November, and some valuation levels nearing historic highs should make for an interesting second half of 2024.