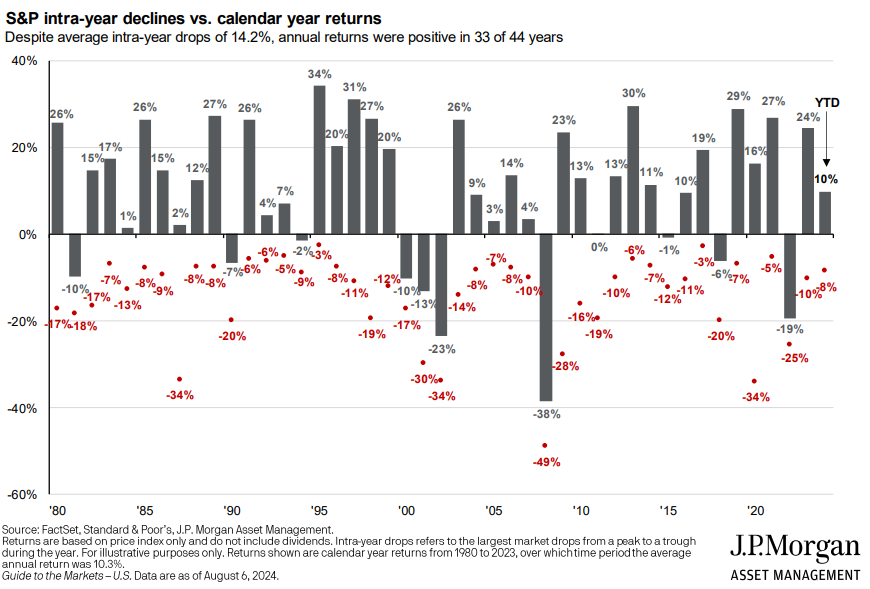
The chart of the week examines the largest intra-year drops in the S&P 500 since 1980. With the recent market turmoil, it’s a good reminder that over the last 44 years, the average intra-year drawdown in the S&P was 14.2%. For comparison, so far in 2024 we have experienced an 8% drawdown. In 25 of those 44 years, the market has dropped more than 10%, and 9 times it has fallen more than 20%. Drawdowns like the one we are currently seeing are very common, and while they are never fun, becoming more comfortable with market volatility should help you be better prepared to meet your long-term investing goals.