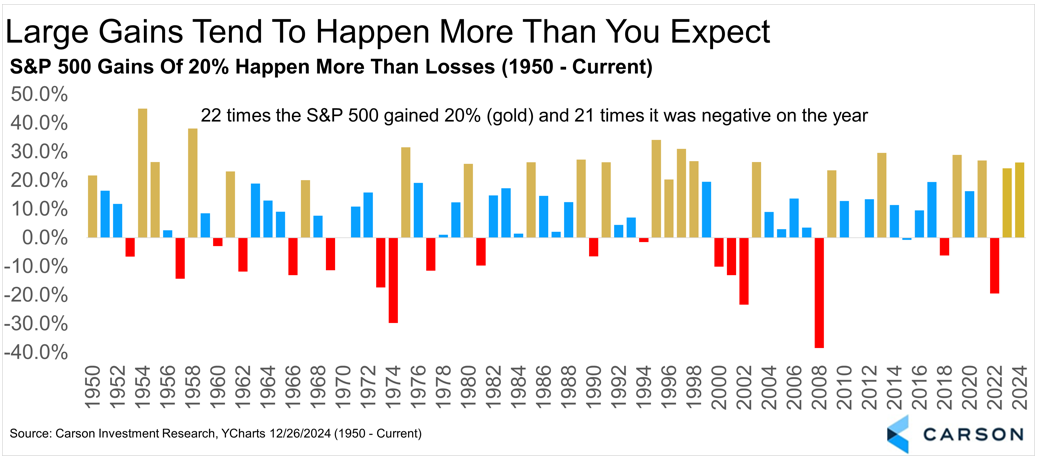
The Chart of the Week highlights S&P 500 annual returns over the past 75 years. In 2024, U.S. equities delivered another strong performance, with the benchmark index achieving a 23% return—mirroring a similarly impressive result from the previous year.
Historically, returns of 20% or more are relatively common, representing nearly half of all positive years for the index. Notably, since 1950, annual gains of 20% or more have occurred more frequently than negative years. While the long-term historical average return for large-cap U.S. stocks is approximately 8–9%, history reveals that large swings—both upward and downward—are more prevalent than one might expect.
Although the short-term direction of the market is inherently unpredictable, volatility remains the price equity investors pay for long-term rewards.